tl;dr
This post is not a guide to implement an observability platform.
It covers what I think are some basics to understand what observability actually is and where it separates itself from monitoring systems and I also document my experiences here.
There is a very good article and talk by Grafana for the implementation:
How to successfully correlate metrics logs and traces in grafana, the video link in the article is not available at the given URL, but it is on a fosdem server: tracing grafana.
Introduction
After depedecy updates in our software, a memory leak has occurred. Almost at the same time, some unwanted behaviour occurred at runtime in some services after the implementation of some features.
As there was no insight into the application at runtime, we created heapdumps of the running jvm and analysed them with the eclipse memory analyzer.
Attempts were made to recreate the problem locally, we analysed the application with open jmx ports and visualvm.
After the problems were solved, the desire arose to have a runtime insight in our applications, to analyse runtime behaviors and problems…
After some meetings I got a bunch of requirements:
- Monitoring of JVM CPU Load, RAM/Heap
- Performance Monitoring
- Count of exceptions
- Count of requrests
- Top 5 requests/error messages…
- Utilization of the DB connection
To implement some of these requirements, I had to choose an application monitoring tool. Since we use the ElasticStack for some business analysis and log aggregation, my first choice was Elastic, also because they have a brand new (but beta) observability feature.
After an evaluation phase, and tests with APM-Server and the beats components, I decided to try out other tools. Mainly because these features are in a too early stage of beta and there was no opportunity to send spring actuator metrics by micrometer to Elastic, there is a github issue, but nothing useful at the time this post was published.
After some discussions about AWS CloudWatch, we decided to do not use it, because we didnt want to have a vendor lock to AWS.
Sooo there are prometheus and grafana as the defacto standard of observability in cloud native.
A simple setup with prometheus and grafana is incredibly easy, so that I could quickly start to evaluate prometheus and grafana. After some evaluation time, I understood that there must me more than just monitoring for an application and this is how I discovered the topic of observability…
A colleague recommended me to read some chapters of googles SRE books, to get more into the monitoring topic.
So I learned some important basics about monitoring, like blackbox & wihtebox monitoring and that I need more data for my requirements than just metrics.
Blackbox & Whitebox
![Blackbox: Polling, Uptime, Monitoring. Whitebox: Metrics, Logs, Traces]](/images/blackbox_whitebox_monitoring.png)
Blackbox monitoring just views a system as blackbox and it will be just monitored from outside.
Symptoms like an increased RAM/CPU consumption become visible, also the availability of a system can be monitored by his interfaces.
Whitebox monitoring enables the detection of future problems and also allows analyzing the current runtime environment.
As example, in a blackbox monitoring we can see that there is an application which does not repsonse, in the whitebox monitoring we will be able to see (at best) why, maybe because there are to many connection to the database or a lot of threads are in blocked state.
To have a deeper look at an application and a better analysis opportunity, we need more data than just metrics…
Observability
From my understanding, whitebox monitoring is observability and blackbox monitoring is the “classical” monitoring with for example checkmk.
Observability drills down into the “what” and “why” of the application, by providing granular and contextual insight into it.
It can start with a symptom pinpointed by a high-level metric.
Your are able to break it down and go from metric to the traces where you can analyse in which span the symptom, like a slow request, occurs.
As in a span can happen a lot, you can go from traces to logs an review the log statements and times for a deep analysis.
Sounds magic?
It is (when the observability system is right configured and you get the data ;) ).
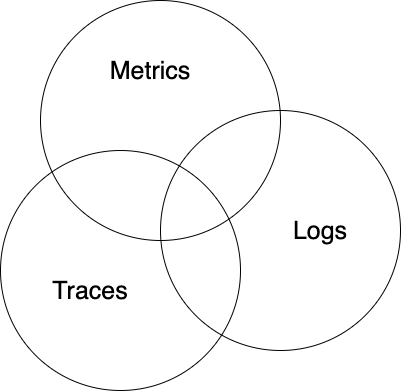
Observability can be divided into three pillars.
The three pillars of observability
Metrics
Metrics are numeric value measured over a period of time, like the average CPU consumption from the last five minutes. They are great for monitoring, if a number gets to high an alert can be triggered…
However, since metrics are aggregated data, they cannot be used to measure everything so easily. The spring actuator (healt/metric endpoint), publishes how much log statements in which log level was logged.
If we visualise these metric with grafana, the output looks like this:
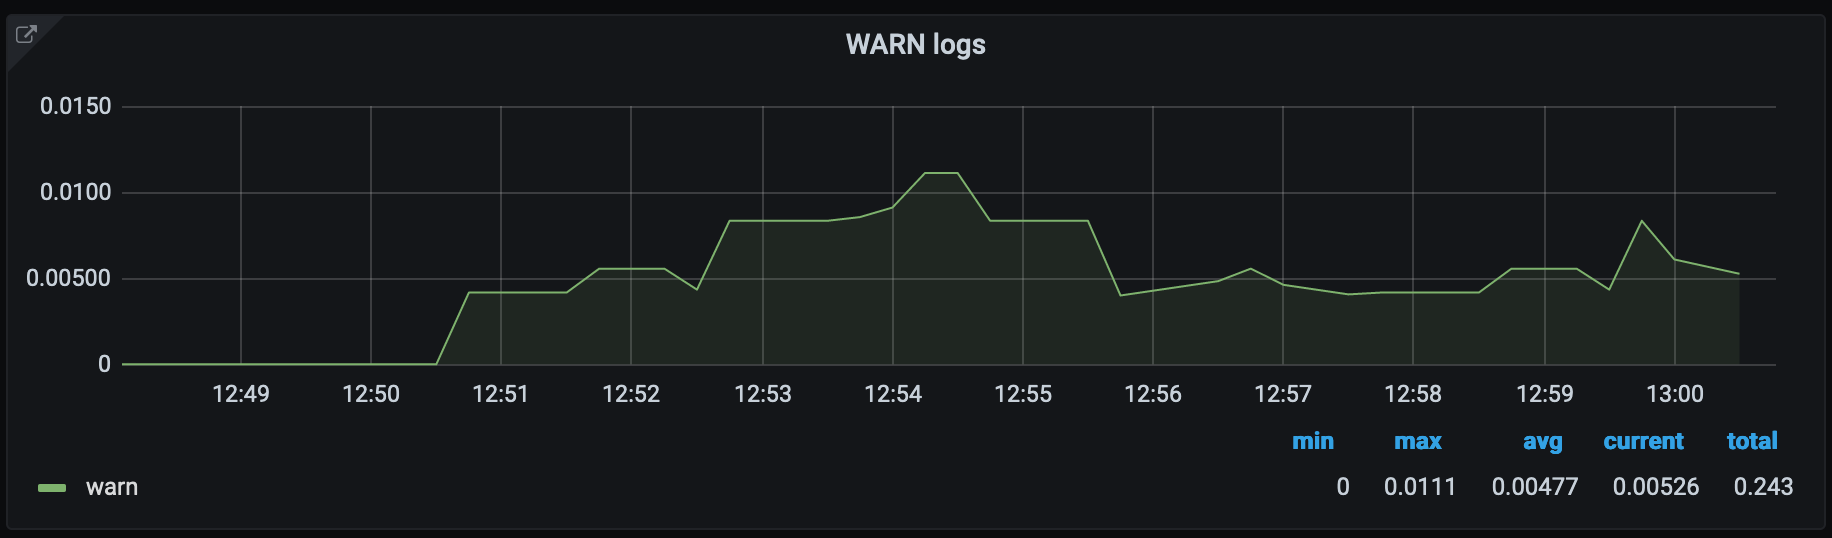
As we can see in the picture, between 12:51 and 12:52 there schould be around 0.00500 log messages logged, since metrics are aggregated we cannot say exactly how many log statements were actually logged.
Soo metrics are great, but you cannot do anything with it, in this case it will be better to visualise from the log data.
To establish a standard format, there is a project called openmetrics.
Logs
“A log is a message, or a collection of messages. They usually have a timestamp attached. Individual logs may or may not be related to each other.”
Quote from: honeycomb events metrics logs
Traces
A trace is a span that represents an execution of code. They have an ID, they can be named and they show how long a execution of code needs.
An image says more than 1000 words… So here is an image.
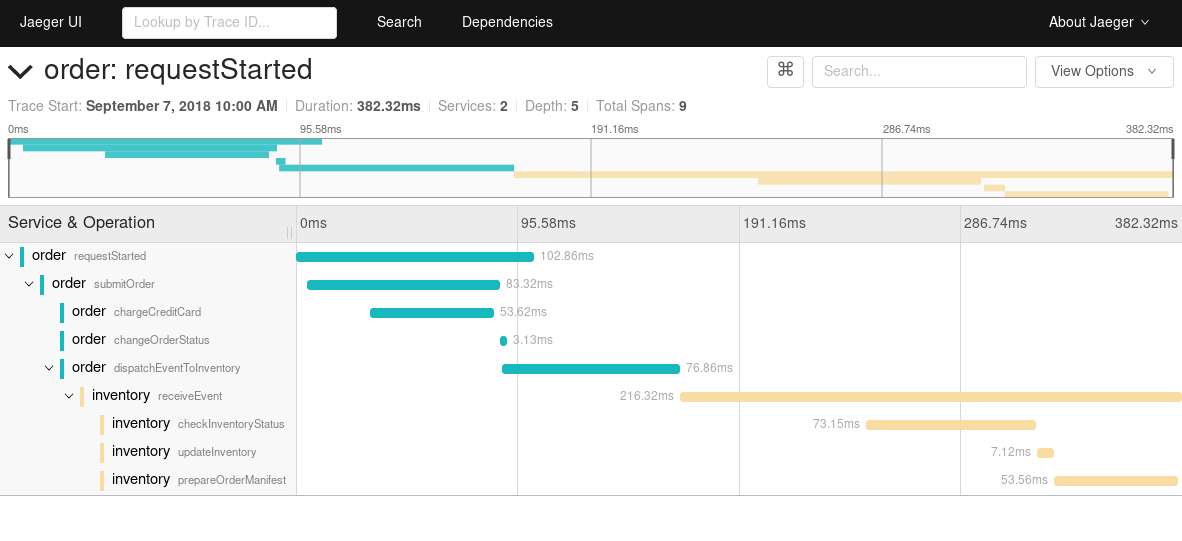
It is often spoken of “distributed tracing”, in a distributed system traces are much more important for analysis. But in a monolithic system, traces are important for easy finding latency issues, too and should not be underestimated.
As for metrics, a standard for tracing exists: opentracing, but opentracing was merged with opencensus to opentelemetry.
Correlation Between Pillars
The interessting part of observability is the correlation between pillars.
To recognize correlations between the individual data sources, each data source must include an ID that is the same across the other data sources.
Thereby we are able to look at the logs of the metric to find out, why as example the CPU usage is increasing. Or look from traces to their logs or metrics…
While logs of metrics are just app data, logs or metrics of traces are always request scoped. Through the correlation of pillars we get maximum visibility into the behavior of the system.
Implementation
As I have mentioned it in the tl;dr, there is a great article for implementation of the observability plattform: how to successfully correlate metrics logs and traces in grafana.
But I want to say a little bit about it. There are a lot of good dasboards for any language or tools in the grafana dashboard marketplace. I decided to create a new dashboard (with exiting panels of other dashboards), to create a whitebox monitoring dashboard for our use case. Furthermore I installed a plugin to use the prometheus alertmanager as datasource and I imported a dashboard for visualisation of the alerts.
At the moment there is unfortunately no possibility to integrate elasticsearch with logs in grafana, so we have to use Loki, to correlate metrics, traces and logs.
As we use spring with logback, I searched for a soultion and found the loki4j, loki logback appender. Which works very good and without problems, but has too few stars on github, so do your thing.
In the article from grafana, jaeger is used as tracing software. We have already integrated zipkin and grafana offers a zipkin integration, so we decided to use zipkin instead of jaeger.
Conclusion
I have followed the article from grafana to build up an observability plattform, I think that Elastic will come in near future with a powerfull alternative to grafana, otherwise there are enough other good solutions like honeycomb, datadog…
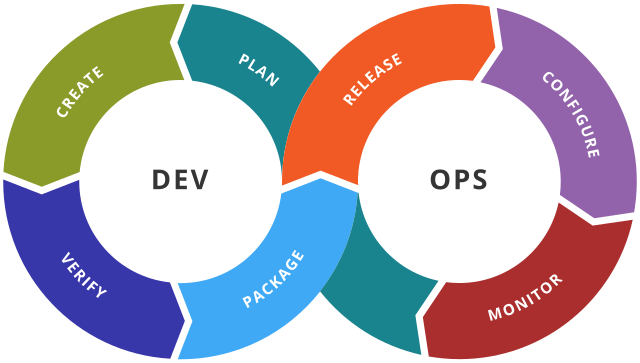
The next challenge is to integrate the usage of the plattform in the development process, to identify potentially problems in the development process and not later in production.
In the devops lifecycle, there is already a part for “monitoring”. As we work in two weeks sprints, we will check grafana before our review meeting and check whether there are unexpected behaviors. I think the comparison of time periods would be a killer feature.
Furthermore an observability plattform smoothes the way to SLOs, with which your application qualitity can be improved. We will definitly define some SLOs after some acclimation time.
Here are two chapters of googles SRE books to SLOs: